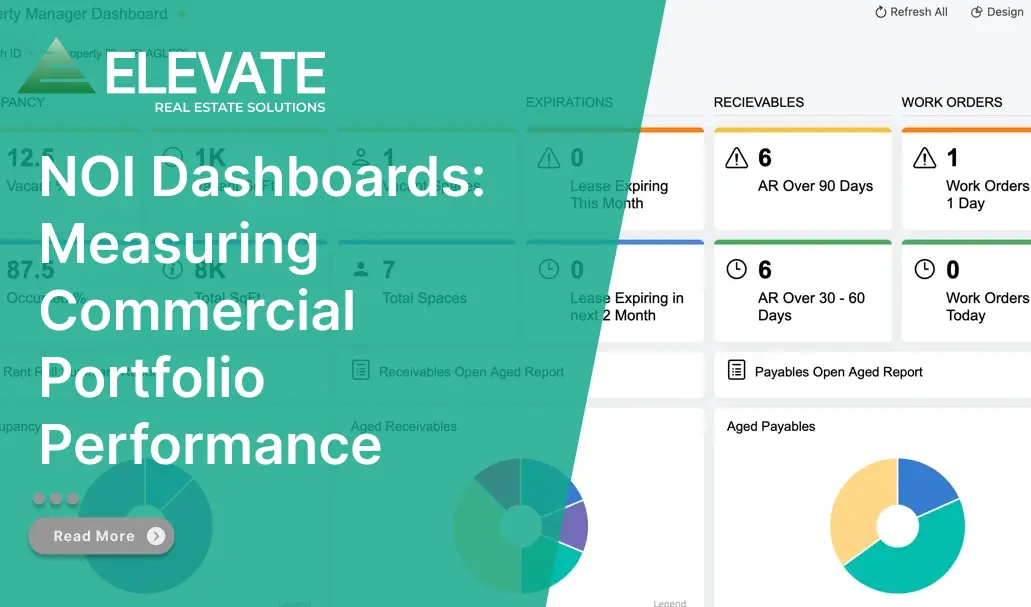
Net operating income is the most quoted number in commercial real estate and one of the least consistently calculated. Two operators can report NOI on the same building and arrive at figures several percent apart, both defensibly, because the line between an operating expense and a capital cost is a judgement rather than a rule.
That matters because NOI drives valuation. At a 6 percent cap rate, a $60,000 difference in reported NOI moves the implied value by a million dollars.
This guide covers how NOI is calculated, what it excludes and why, the judgements that make it inconsistent, and how to build dashboards that show where NOI is heading rather than where it has been.
What is NOI?
Net operating income is the income a property generates from operations after operating expenses, before financing costs, income taxes, depreciation and capital expenditure.
The calculation is straightforward: effective gross income less operating expenses.
Effective gross income is potential rental income, plus expense recoveries and ancillary income such as parking and signage, less vacancy and credit losses.
Operating expenses are the costs of running the property: property taxes, insurance, utilities, repairs and maintenance, management fees, janitorial, landscaping, security and administrative costs.
The purpose of the exclusions is comparability. By stripping out financing, tax position and depreciation, NOI describes the property’s operating performance independent of how it was bought or who owns it, which is what makes it usable for valuation and for comparison across a portfolio.

What NOI excludes, and why the exclusions cause arguments
Four exclusions are standard, and two of them are where the inconsistency creeps in.
Debt service. Excluded so the property can be valued independently of its financing. Uncontroversial.
Income taxes. Excluded because they depend on the owner’s position rather than the asset. Uncontroversial.
Depreciation and amortisation. Excluded as non-cash accounting charges. Uncontroversial.
Capital expenditure. Excluded in principle, and this is where the arguments start. The boundary between a repair, which is an operating expense, and a capital improvement, which is not, is a judgement call made property by property.
A roof repair is an operating expense. A roof replacement is capital. A partial roof replacement that extends useful life is arguable. Treating it as capital raises reported NOI and therefore implied value. Treating it as operating lowers both. Neither is wrong, and the difference is real money at any cap rate.
Two further items sit in the same grey zone. Tenant improvements and leasing commissions are usually excluded from NOI as capital costs, though some operators deduct them to arrive at a cash-flow-after-capital figure. Replacement reserves may be deducted as an expense or excluded, and the treatment varies by whether the figure is prepared for internal management or external valuation.
The practical consequence: when comparing NOI across properties or against a benchmark, confirm the treatment before concluding. Consistency within a portfolio matters more than matching any external convention.
What NOI does not tell you
NOI is a snapshot of operating performance. Three things it cannot show, and all three are where portfolio problems actually originate.
Where it is heading. A property with NOI up 4 percent and 40 percent of its leases expiring within eighteen months is not performing well, it is performing well temporarily.
What drove the change. NOI up 4 percent could be rent growth, better recovery, deferred maintenance, or a one-off recovery true-up. The first two are performance and the second two are not.
Quality of the income. Two properties with identical NOI differ materially if one has investment-grade tenants on ten-year terms and the other has short-dated leases with weaker covenants.
This is the case for dashboards over reports. A report tells you the number. A dashboard should tell you what it is composed of and which direction it is moving.

What belongs on an NOI dashboard
Six views, in this order of usefulness.
1. NOI by property with variance to budget
Actual against budget per property, with the variance decomposed into revenue and expense components. Portfolio-level NOI on budget can conceal one property well ahead and another well behind.
2. NOI trend across periods
Rolling twelve months by property. Direction over three or more periods carries more signal than any single period’s value, and it distinguishes a trend from a one-off.
3. Revenue composition
Base rent, expense recoveries and ancillary income tracked separately. A recovery-driven NOI increase behaves differently from a rent-driven one, because recoveries true up annually and can reverse.
4. Lease expiry profile
Square footage and income expiring by period, per property and across the portfolio. This is the forward-looking view NOI itself cannot provide, and it is where the next two years of risk sits.
5. Occupancy against economic occupancy
Physical occupancy is space leased. Economic occupancy is income received against income at full occupancy and market rent. The gap between them shows free rent periods, below-market leases and collection issues that physical occupancy hides.
6. Expense detail with recoverable split
Operating expenses by category, showing what is recoverable against what the owner absorbs. Rising recoverable expenses affect tenants and renewal risk. Rising non-recoverable expenses hit NOI directly. The distinction changes what you do about it.
Elevate’s commercial property management software produces these at property, entity or portfolio level with drill-down into the underlying transactions.
Why NOI reporting is usually late
Most operators can produce accurate NOI. Most produce it weeks after the period it describes, which limits what can be done with it.
Three causes.
Recovery income is estimated until reconciliation. Monthly recovery billing is an estimate, and the true-up arrives annually. Interim NOI carries an estimate in one of its largest revenue lines, and the accuracy of that estimate is rarely revisited during the year.
Expense classification happens late. Where recoverability and the capital-versus-operating decision are made at period end or year end rather than as invoices post, NOI cannot be calculated until that sorting is done.
Consolidation is manual. Portfolio NOI assembled from per-entity figures in a spreadsheet is only as current as the last time someone built it.
Fixing the timing is mostly a matter of moving classification decisions to the point of posting rather than the point of reporting.

NOI and capital projects
Capital work is excluded from NOI, which creates a reporting gap for firms doing meaningful capital or tenant improvement work.
A property showing strong NOI while consuming significant capital is not generating the cash the NOI figure implies. Investors and lenders know this, which is why they ask for NOI alongside capital expenditure rather than in isolation.
The practical requirement is that capital projects are tracked with their own budgets and cost codes, separately from operating expenses, so that the classification is a property of the record rather than a judgement made at reporting time. Where a firm self-performs the work, keeping project costs distinct while still posting to the correct property entity is a matter of platform design.
For firms that develop assets they go on to operate, the same separation runs back to the earliest stage: a project’s cost structure needs to stay distinct from the operating expenses of the stabilised asset it becomes.
Both are built on Acumatica’s project and construction accounting layer.
Using NOI well
Three practices separate operators whose NOI reporting drives decisions from those whose NOI reporting describes history.
Define the treatment and apply it consistently. Write down how the firm treats the capital-versus-operating boundary, replacement reserves, and TI and leasing commissions, and apply it across every property. Internal consistency matters more than matching any external convention.
Report NOI with its composition. A number without its revenue and expense decomposition invites the wrong conclusion about what caused a change.
Pair it with the forward view. NOI plus lease expiry profile plus economic occupancy tells you where the portfolio is heading. NOI alone tells you where it has been.
Elevate is an Acumatica Gold Certified Partner founded by CPAs, with nearly 40 years working with commercial property managers. Book a 20-minute discovery call to see portfolio reporting on live data.